Operating budgets are used to determine estimated income and expenses over a specified period of time.
Operating Budgets
The timeliness of preparation and review should be specified in the company’s budget policies and procedures.
Operating budgets should account for every major sector of the business including, but not limited to, sales, purchasing, production, marketing, IT, finance and administrative expenses.
The operating policies and procedures of the business will stipulate the level of detail required in the operational budgets.
Budgets will vary between businesses that operate in different industries for example, a service industry will not have to budget for production costs. Examples of these are provided in the next section.
The Budget Process
Budgeting and its processes is considered the tactical implementation of a business plan put in place.
To achieve the goals in a business’s strategic plan, there has to be a detailed descriptive roadmap of the business plan that sets measures and indicators of performance.
We can then make changes along the way to ensure that we arrive at the desired goals.
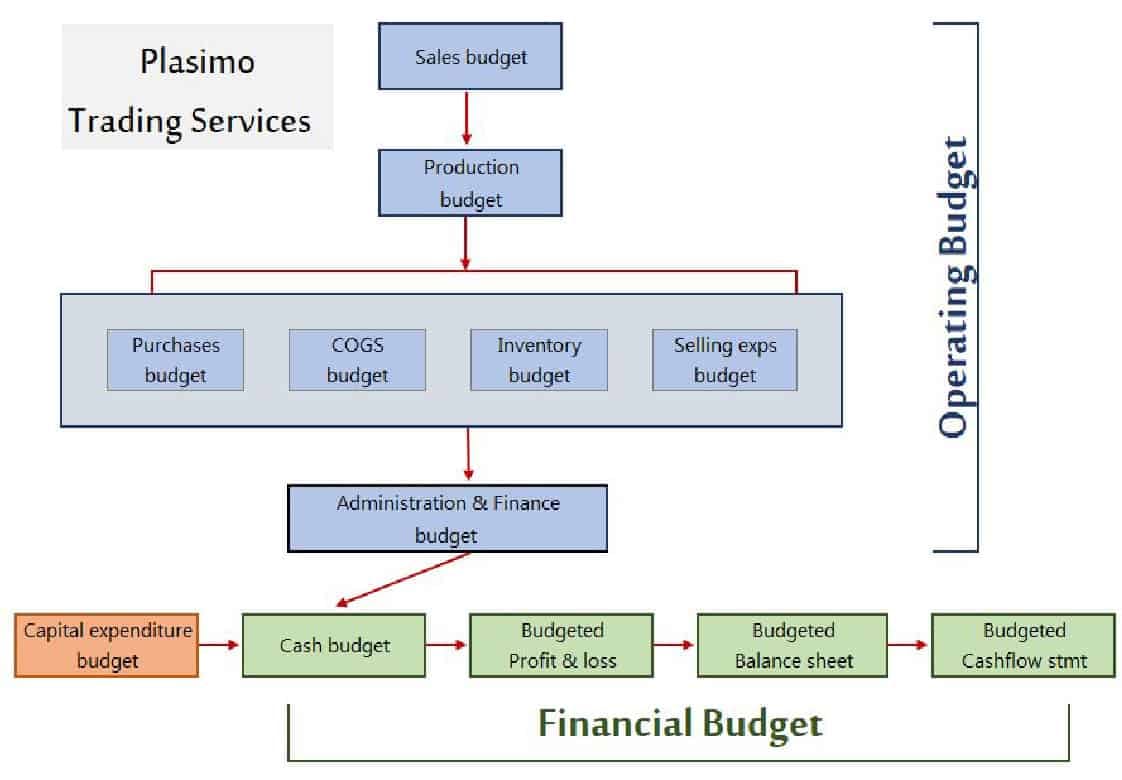
There are many methods on how to create a budget but below shows an example of the preparation order for a test company Plasimo Trading Services.
Preparation Order for Operating Budgets
As shown in the earlier example of Plasimo Trading Services, the first budget to be prepared is the sales/fees budget. This budget contains the estimated revenue for the period and provides scope for the preparation of the expense and then the cash budgets.
- Sales
- Purchasing & Production
- Expenses
- Cash

Sales Budgets
The sales budget is normally the first operational budget produced and is prepared using the estimations in the sales forecast. The level of detail required in the sales budget will be specified in the business policies and procedures.

This budget is an integral part of the process as it contains the estimated number of items to be sold (units) or revenue (dollars) expected for the period.
- A service organisation will prepare a professional fees budget.
- Trading and manufacturing firms will prepare a sales budget broken down by product into unit quantities and sales revenue.
It is extremely important to prepare the sales budget as accurately as possible as the sales budget forms the basis for the scope of the other budgets.
- You need to know how much of a product to make to work out costs and gross profit. The gross profit will give you an idea of how much money remains which can be spent on other areas of the business such as marketing and general expenses.
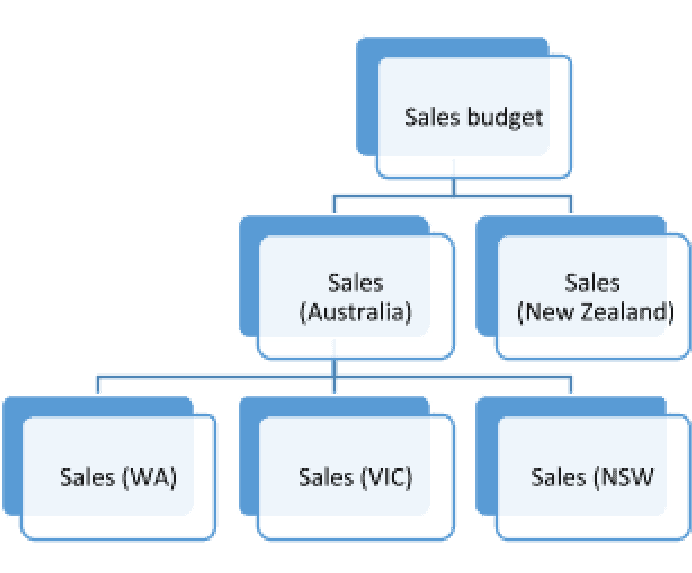
- Sales budgets can be broken down by various different levels according to the business operations. Examples are sales by region, agent, period, product, season or a combination of all.
Example of a sales hierarchy by sales division.

Sales Budget Format – Trading Firm
Trading industries include both retail and wholesale businesses. These businesses buy and sell goods to retailers and to consumers, e.g. supermarkets, department stores and furniture stores.
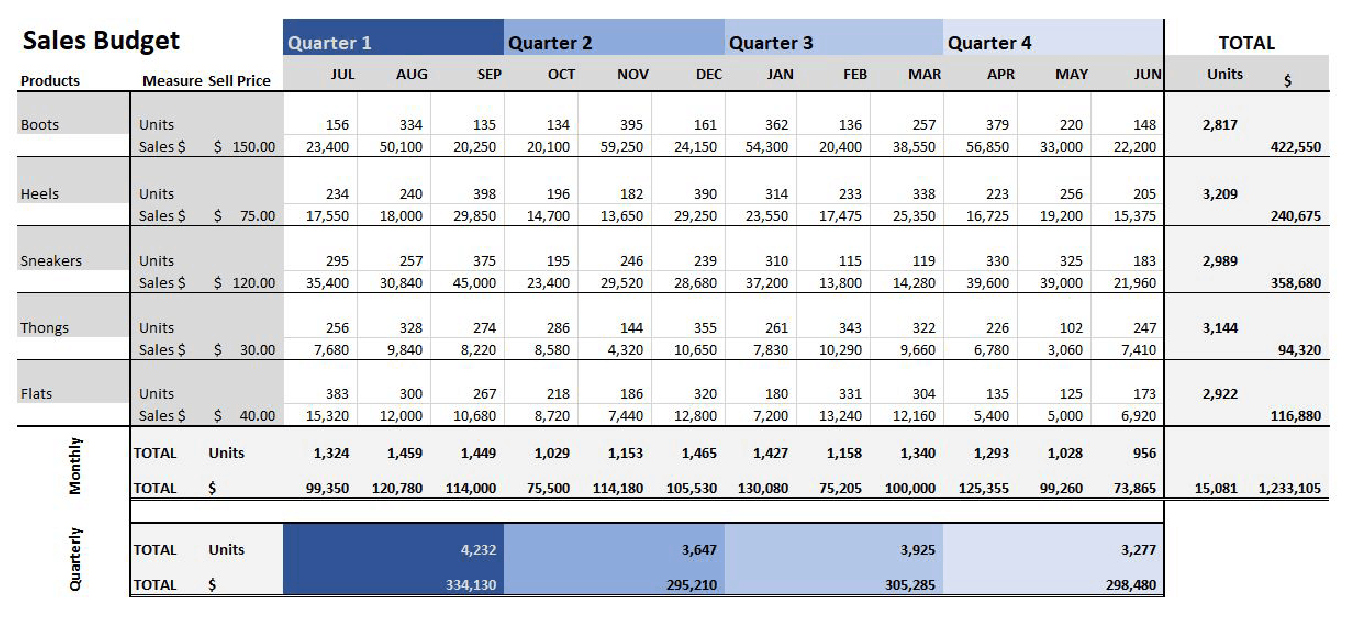
Below is an example of a Sales Budget for a trading firm. Sales estimates are broken down by product, month, quarter and year.
Details at this level provide the sales manager with a summary of estimated product performance by unit and revenue over different periods (months, seasons and year).

Sales Budget Format - Service Firm
A service firm does not generally sell products, so their sales budget is based on their estimated fees for the period.
The Fees Budget can be calculated based on the information provided in the sales forecast such as:
- Number of staff
- Estimated working hours for staff
- Estimated hourly rates
The idea is to calculate the estimated fees that will be billed to clients on a monthly basis and end up with a fees budget in a format similar to the below example.
Note: As not all months have an equal number of days or weeks, the calculation assumptions will be specified in the company’s policies and procedures.

Cost of Goods Sold Budget
Cost of goods sold is the accumulated total of all costs that are directly attributable to the creation of a product (cost of merchandise purchased, direct materials, direct labour etc.)
The cost of goods sold amount is deducted from the total sales figures to determine the gross profit. The gross profit can be calculated at different levels for example, gross profit per product or gross profit per period or just an overall gross profit per month or year.
Cost of goods sold fall into two-categories:
Direct materials cost
Direct materials are the traceable items used to manufacture a product and is calculated at a cost per unit.
For example, direct materials for a business that manufactures clothing would include the fabric, thread, buttons, zips etc. These costs are detailed in a bill of materials to calculate a price per unit.
There will also be some indirect costs incurred. These are costs that are not specific to one single product (such as baking pans used in the process to make cupcakes) and are referred to as indirect costs.
Direct labour
Direct labour refers to the ‘labour’ (staff or machine hours etc.) required to produce a product and is usually calculated at a cost per hour. It is considered to be a direct cost meaning that it varies directly with revenue or some other measure of activity.
For example, to make one product requires 3 labour hours at $42 per hour.
$42 per hour x 3 hours = $126 direct labour cost per unit.
Examples of a Costs of Goods Sold budget are below. The first one shows the calculations of the costs of goods sold.
The second example shows how the COGS budget ties in with the sales budget. Calculations are discussed on the following page.
Examples show the COGS calculation for one product only. In business, this would be done for every product.
Example A) COGS budget without the gross profit calculation.
This budget shows just the cost of goods sold calculations. (How much it costs to produce the items to be sold).

Example B) COGS budget with the gross profit calculation.
This is the next step of COGS budget and analysis. Sales revenue figures are required to calculate the gross profit per product.
At this point, the sales and production manager will work together to ensure all products are profitable.

Common Calculations
The following are the most common formulas used when preparing and analysing budgets.
Cost of goods sold – Income Statement
Costs of goods sold is found on the profit and loss statement and is usually calculated by:
Opening Inventory ADD Purchases LESS Closing Inventory
Costs of goods sold – per product
Costs of goods sold can also be calculated at a product level (part of the COGS budget).
As in Example A above:
ADD the total of all cost of goods sold items (eg direct materials + direct labour), or
As in Example B above:
Selling Price LESS Cost of Goods Sold
Total Cost of goods sold
To calculate the total value of costs of goods sold
Total Number of Units Sold MULTIPLIED Cost of Goods Sold per unit
2,989 units sold x $96 per unit = $286,944
Mark-Up % - Selling price calculation
Quite often management will stipulate a mark-up percentage on products, or it will be defined in the company’s budget policies and procedures. This mark-up helps to calculate a draft unit selling price. In this example, mark-up has been set at 25%.
Cost of goods sold MULTIPLIED by One plus the Mark Up Percentage.
$96 x (1 + 0.25) = $120 selling price
Mark-up Percentage per unit
If the selling price and the COGS values are known, we can work backwards to calculate the mark-up percentage on cost.
Selling Price DIVIDED by Cost of Goods Sold LESS one
( $120 / $96 ) – 1 = 0.25 mark up percentage
Gross Profit
Money a company earns after subtracting the costs associated with producing its products.
Revenue LESS Cost of goods sold
Gross Profit Margin
Shows the percentage of revenue that exceeds a company’s costs of goods sold. It demonstrates how well a company is generating revenue from the costs involved in producing the products.
(Revenue LESS Cost of Goods Sold) DIVIDED by Revenue
Or (Gross Profit DIVIDED by Revenue)
If you are looking to re-skill or up-skill but unsure of which course best suits you, get in touch with one of our consultants today and we will endeavour to help you.


