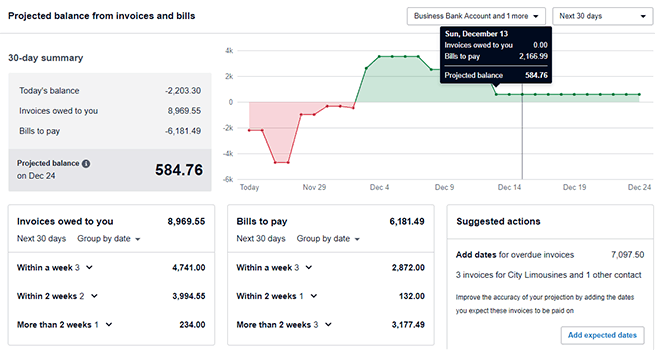
Bookkeepers using accounting packages such as MYOB and Xero can use forecasting as a way to plan and predict futures cash flows and budgets. It can be useful for predicting issues before they arise, from simple reports forecasting accounts receivable and payable cash flow and for long term budgeting and planning.
Forecasting for Bookkeepers
What is forecasting and how is it used in Accounting?
Forecasting uses historical data, statistical models and market conditions to predict financial outcomes. The models prepared provide a means of reconciling back to the company’s financial plan. Smaller businesses may incorporate forecasting and budgeting in the same process.
The objectives of forecasting are to form the basis for:
- Planning capacity
- Production and inventory
- Workforce requirements
- Sales and market share
- Finances and budgeting
- Research and development
The forecast becomes a starting point for managers to prepare budgets. The Bookkeeper assists by preparing and liaising with managers on what information is required. Tools such as Xero Custom reports are perfect for breaking down expense accounts for example into different groups.
Forecasts are reviewed regularly as new information becomes available. They can then be adjusted accordingly to achieve more accurate future predictions.
Pro-forma statements (estimated profit & loss, balance sheet) are often prepared at this stage. Any future financing needs will be highlighted.
Unlike budgets, variances are not analysed between forecasts and actual performance.
A variety of forecasting methods are available. However, consideration must be given to cost, preparation time, accuracy, and period. The manager must understand the assumptions on which a forecast method is based to obtain maximum benefit.
The forecasting process may be both costly and time-consuming, and organisations need to balance the cost of generating forecasts against the need to obtain more accurate results.
Forecasting Techniques
Forecasting models use statistical and analytical techniques to gain an understanding of a larger population by analysing the information of a smaller population (sample). These techniques substantiate predictive forecasts.
Statistical Analysis
Businesses typically use statistical analysis when forecasting and analysing trends in the market.
It follows the following key principles:
- A description of the data to be analysed and the statistical method used.
- Explores the relationship of the data to the sample population.
- Creates a model to show the relationship of the data to the sample population.
- Validates the model of the relationship between variables (shows the relationship between cash, expense and revenue items and enables people in different departments to understand the impact of their budget on the master financial budget).
- Allows prediction of a situation or trend that is most likely to occur in the future.
Methods to develop sales forecasts can be categorised into qualitative and quantitative factors.
Qualitative Methods
Think Quality - How good is the data you are obtaining from managers for use in your predictions?
Qualitative methods of forecasting are more commonly used when historical data is not available. These methods depend on the subjective judgment, opinion and the experience of staff and managers.
Qualitative methods include:
Executive opinions
This method relies on expert opinions of key personnel of various departments such as sales or purchasing. Information is gathered from these managers to arrive at future predictions. The management team makes revisions in the resulting forecast based on their expectations.
Referred Class Forecasting
This method involves predicting the outcome of a planned action based on a similar scenario in another time or place.
Delphi technique
The Delphi technique is a consensus opinion of experts achieved through a series of questionnaires. The responses from the first questionnaire are used to produce the next questionnaire. This process continues until the researchers have a narrow shortlist of opinions. The experts are kept separate from each other which eliminates any pressure of bias from the majority opinion.
Market research
The systematic, formal, and conscious procedure for evolving and testing a hypothesis about real markets. Existing and potential customers are surveyed to find out the type of products they intend to buy and in what quantities.
Scenario writing
In this method, the forecaster generates different outcomes based on diverse starting criteria. The management team decides on the most likely outcome from the numerous scenarios presented.
Panel consensus:
This technique is based on the assumption that several experts can arrive at a better forecast than one person. There is no secrecy, and communication is encouraged. The forecasts are sometimes influenced by social factors and may not reflect a true consensus.
Quantitative Methods
Think Quantity - Use “numbers”, eg from your reports to predict future likely outcomes.
Quantitative methods are used when historical data is available and can be analysed to calculate estimates. This method is appropriate if market forces are relatively stable, and sales patterns and trends are not likely to change in the future.
It is common to use mathematical modelling which can be produced by specialised computer software or the use of spreadsheets.
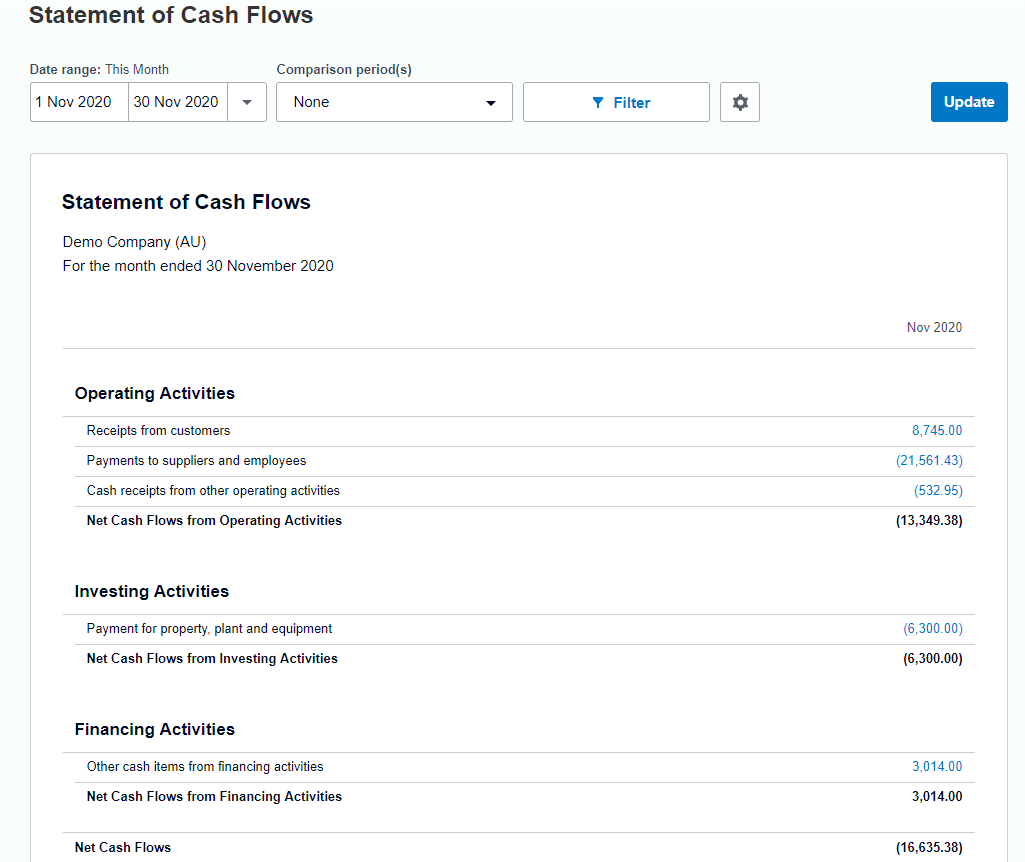
Example Statement of Cash Flows From Xero
Quantitative methods include:
Time-series approaches
Data is gathered over a period of time to identify trends. Some techniques that fall within this method are moving averaging and exponential smoothing.
- Moving average
Each point of a moving average of a time series is the arithmetic or weighted average of a number of consecutive points of the series, where the number of data points is chosen so that the effects of seasonal or irregularity or both are eliminated.
- Exponential smoothing
Similar to the moving average except that more recent data points are given more weight. The new forecast is equal to the old one plus some proportion of the past forecasting error.
- Historical
This is a comparative analysis of the introduction and growth of similar new products that base the forecast on similar patterns
Cause-Effect method
The forecaster examines the cause and effect relationship of the variable with other relevant variables. You assume that if key causal variables are known, sales levels can be forecasted.
Factors that impact revenue forecasting
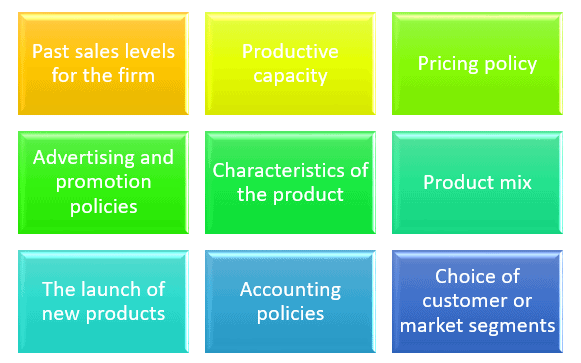
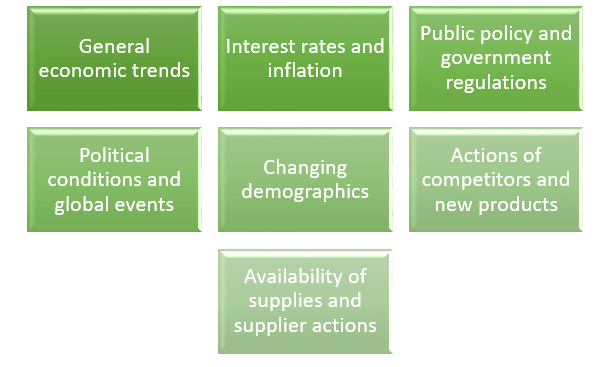
Irrespective of whether qualitative or quantitative methods are used, there are controllable and uncontrollable internal and external factors which will impact on the assumptions on which the forecast is based.
Controllable factors may include:
Uncontrollable factors include:
Source: Clowes & Scrivan, 2011, p.28)
Managers use forecasts to assist in the preparation of their budgets. A forecast will aid in determining the volume of production, inventory needs, labour hours required, cash requirements, and financing needs.
Sales forecasts are especially crucial aspects of many financial management activities, including budgets, profit planning, capital expenditure analysis, and acquisition and merger analysis.
- Marketing managers – use sales forecasts to determine sales staff allocations, set sales goals and plan promotions and advertising. Market share, prices, and trends in new product development are also required.
- Production planners – need forecasts to schedule production activities, order materials, establish inventory levels and plan shipments. Other areas that need forecasts include material requirements (purchasing and procurement), labour scheduling, equipment purchases, maintenance requirements, and plant capacity planning. As soon as the company makes sure that it has enough capacity, the production plan is developed. If the company does not have enough capacity, it will require planning and budgeting decisions for capital spending for capacity expansion.
- Financial managers - estimate the future cash inflow and outflow. They must plan cash and borrowing needs for the company’s future operations. Forecasts of cash flows and the rates of expenses and revenues are needed to maintain corporate liquidity and operating efficiency.
Forecasts are needed for money and credit conditions and interest rates so that the cash needs of the firm may be met at the lowest possible cost.
Forecasts must also be made for interest rates, to support the acquisition of new capital, the collection of accounts receivable to help in planning working capital needs, and capital equipment expenditure rates to help balance the flow of funds in the organisation.
In planning for capital investments, predictions about future economic activity are required so that returns or cash inflows accruing from the investment may be estimated.
Sound predictions of foreign exchange rates are increasingly important to managers of multinational companies.
- Human Resource manager –requires a number of forecasts in planning for human resources (staff). Workers must be hired, trained, and provided with benefits that are competitive with those available in the firm’s labour market. Also, trends that affect such variables as labour turnover, retirement age, absenteeism, and tardiness need to be forecast for planning and decision-making.
Forecasting Examples – Historical analysis, sales units increase
ABC Clothing Company sells children’s clothing per the below table.
The Sales Manager has advised that the brand has been very popular with customers with particular interest in the brand’s jumper.
Using last year’s sales as a base and adjusting for the current customer feedback and sales trends, the Sales Manager estimates:
- Unit sales of the jumper to increase by 15% and
- All other products to increase by 10%.
Sales budget for the following year is as follows:
| Product | Sales units
(last year) |
Sales units
(coming year) |
Sale price
per unit |
Total budgeted sales $
(coming year) |
| T-shirts | 2,000 | (2,000 x 1.10) = 2,200 | 20 | 44,000 |
| Shorts | 3,000 | (3,000 x 1.10) = 3,300 | 25 | 82,500 |
| Caps | 1,000 | (1,000 x 1.10) = 1,100 | 12 | 13,200 |
| Jumpers | 4,000 | (4,000 x 1.15) = 4,600 | 30 | 138,000 |
| Total | 10,000 | 11,200 | $277,700 |
EXAMPLE – Historical analysis, sales units by state
Historical statistical analysis is particularly useful when analysing data with multiple different drivers, for example; products that are sold seasonally, products sold in different geographical areas, divisions or by various Sales Agents or Stores etc.
This information will assist managers to forecast sales data to create the sales budget for the coming year.
Analysis at this level can highlight problem areas and allow them to be addressed prior to the new budget. For example, if a sales division is not performing well, an investigation can be conducted to estimate the source of the problem. Perhaps the problem is a HR issue (i.e. the Sales Agent is underperforming) or it could be related to an external cause such as a change in the economy for that area resulting in reduced customer spending.
Swell Beach Supplies sells beach related products through its own stores located in WA, SA, NSW and QLD. The business has been operating for many years in WA, NSW and QLD and only opened the store in SA last financial year. Actual sales figures from last financial year are provided below.
| Product | Sales – Units Sold (last year) | Total Units | % of Total | |||
| WA | SA | NSW | QLD | |||
| Watches | 2,000 | 2,200 | 2,700 | 2,100 | 9,000 | 14% |
| Sunglasses | 6,600 | 3,300 | 5,200 | 7,000 | 22,100 | 33% |
| Caps | 3,200 | 3,500 | 3,600 | 3,800 | 14,100 | 21% |
| Snorkel & Mask | 4,500 | 100 | 3,200 | 5,600 | 13,400 | 20% |
| Swell Beach umbrella | 2,600 | 1,000 | 1,800 | 450 | 5,850 | 9% |
| Total | 18,900 | 10,100 | 16,500 | 18,950 | 64,450 | |
| % of Total | 29% | 16% | 26% | 29% | ||
The Sales Manager is in the process of preparing the sales budget for the coming financial year. In this example, we will use the historical data of actual unit sales to work through some of the decision-making criteria.
Firstly, we will look at the performance of the different sales divisions and decide whether any adjustments need to be made at this level for the coming financial year.
- SA has the least amount of sales. As the store is relatively new, sales are expected to be lower than the other divisions while the brand gains interest. Sales are also expected to always be lower for this division due to the cooler climate in the region.
- There is no significant high performing division.
We will now look at the performance of the different products.
- Sunglasses are the most popular product over-all and sell well in all states with the exception of SA. The Sales Manager expects sunglass sales to be lower in SA due to the cooler climate.
- Watches are consistent over all states, but they are in the bottom two products for the lowest sales. Sales Manager has decided to increase marketing for this product.
- Cap sales are consistent over all states. They are a reliable product with average sales.
- Sales of the Snorkel & Mask are consistent in all states with the exception of SA. The Sales Manager does not expect sales to increase due to the cooler climate in SA and as the product is significant in size and bulky to warehouse, the Sales Manager has decided to remove this product from the SA product line in the next financial year.
- The Swell Beach Umbrella returned interesting sales figures. It was the least popular product with particularly low sales in QLD. The Sales Manager predicted umbrella sales in QLD would be similar to the WA. Investigation into other factors was performed and the Sales Manager was considering removing this product from the QLD product line. This umbrella itself is a branded umbrella with the company name printed in large letters. Although sales of the umbrella were low in QLD, the division itself is the highest performing division so the Sales Manager has decided to keep the umbrella in the QLD product line as it acts as a means of inadvertent marketing for the brand.
When analysing historical data, it can be helpful to generate a visual display. In the example below, the very low sales of the Snorkel/Mask in SA are quite obvious.
EXAMPLE – Historical forecasting using Excel
The following example uses Microsoft Excel to forecast future sales based on a trend line.
If a business were to graph its historical sales per year, a trend line can provide an indication expected future sales. The formula is shown further below.
The TREND and FORECAST formula can provide the same results in a table format.
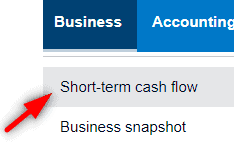
Here is an Example from Xero using the "Short-term cash flow" report.
- Click the Business Menu
2. Then Choose Short-term cash flow
Enjoy this topic? Study the Certificate IV in Accounting and Bookkeeping to learn more
If you are looking to re-skill or up-skill but unsure of which course best suits you, get in touch with one of our consultants today and we will endeavour to help you.


